I can access, read, interpret, and create maps and other geographic representations as tools of analysis. Cartographers decide what information goes into the maps.
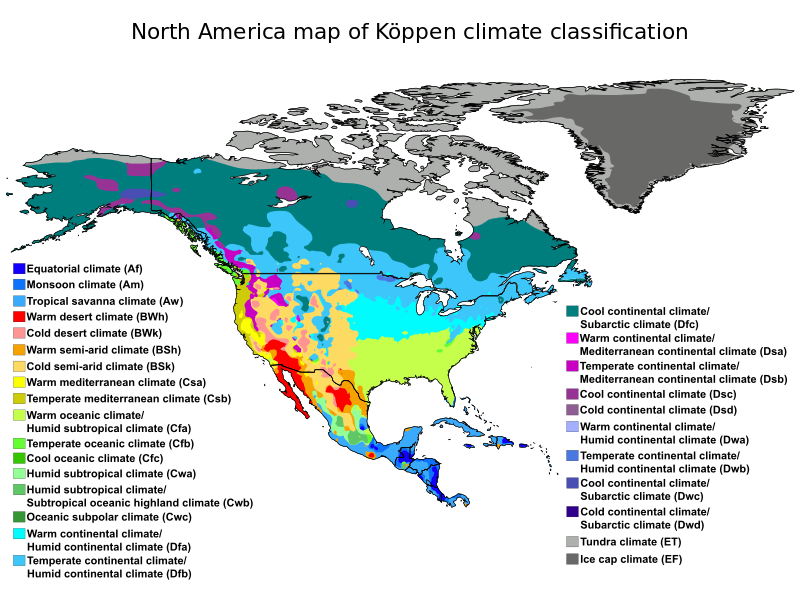

Always need to make sure you read the key so you know what the colors stand for on the map. In this map to the left, the colors are the average LOW temperatures for each area.

